K Nearest Neighbors
K Nearest Neighbors
K-Nearest Neighbors or KNN is a popular and very simple classification algorithm.
There are two different shapes of data points in the image, triangle and square. Let's say these two shapes denote two different classes. Let us consider the image of dogs with triangles, and the images of cats with squares. The shape of the two points is the animal's distinguishing feature. A circle in the middle is our unknown data point, i.e. we don't know if it's a dog or a cat picture. Now we need to classify this unknown data point, i.e. whether it is a dog image or a cat image.
The animal will move towards the point which is the closest shape to the circle point. We set the value of "K" to three once. So I will take the three points which are near the circle. So it appears that for K=3 one triangle and two square points are found. Since the square has more points, that means the circle is a cat (since we're not holding a dog image with a triangle, and a cat image with a square).
Now if we take the value of "K" as five, then for k=5 we get three triangle and two square points, so the circle is a dog.
Now come, how much value of K we take? Usually the value of "K" is assumed to be an odd number (1, 3, 5, 7...etc). The reason for this is, suppose if, take K=4 i.e. take 4 points. If two points are pictures of cats and the remaining two points are pictures of dogs, then the tie will be even. Then it becomes difficult to classify the circle point. For this reason the value of K is usually taken to be an odd number.
Here we see two types of answers based on distance and votes as "K" values are three and five.
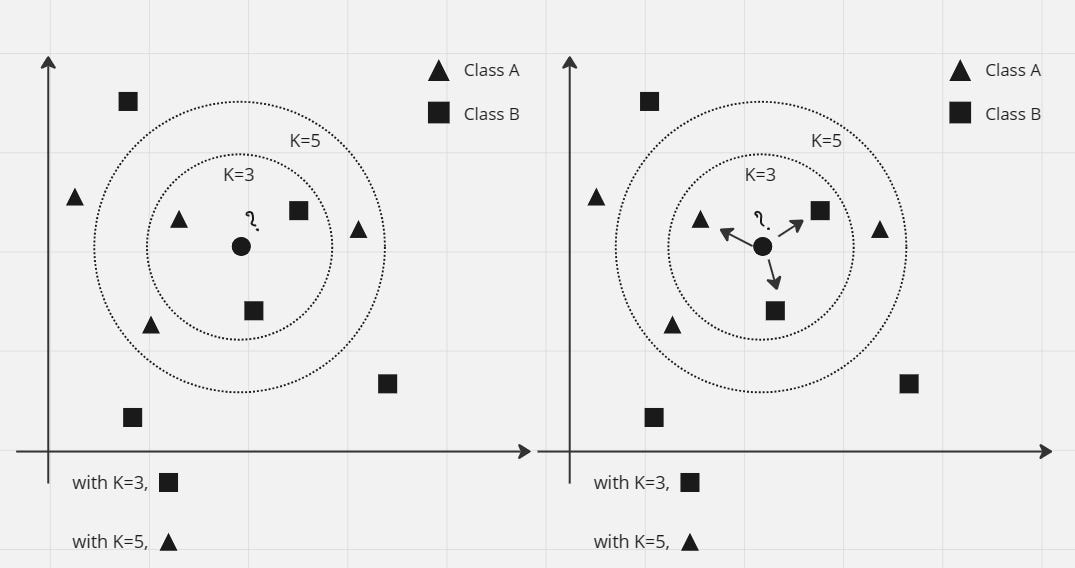
Image options
We have to predict the circle shaped points (unknown animals).
So its main steps are four -
- Find the distance from the unknown data point to all remaining data points
- Data points should be sorted from smallest to largest size (or, Ascending Order) according to the distance value.
- The first K-number of points must be taken from the sorted data points.
- Among these K-number of data points, the class that has the most number of points, the unknown data point should be identified as being in that class.
Let's look at an example. The following chart shows the values of the x1 and x2 feature values for the data points in the figure above. Along with that, we have also written which data point belongs to which class in the last column. Here 1 means dog (triangle), 0 means cat (square).
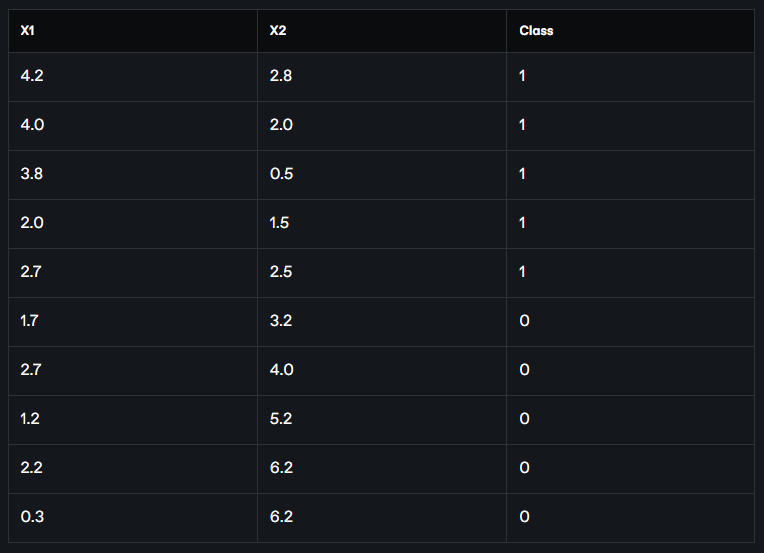
Two of the feature values of the unknown data points are (2.2, 3). We now need to figure out if this unknown data point is a dog, or a cat.
So what we will do now is first find the distance from the (2.2, 3) point to all the data points in the table. We will apply the Euclidean distance formula to find the distance. The Euclidean distance between two points (x1, y2) and (x1, y2) is,

Now we find the Euclidean distance of the point (2.2, 3) from all the data points:
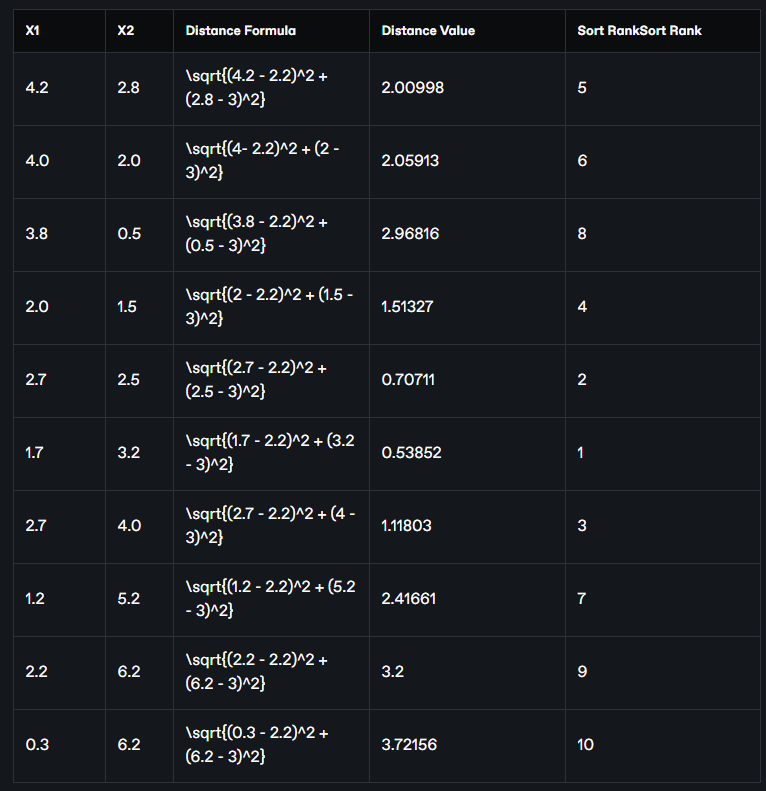
Now we sort these data points in descending order of distance mean from smallest to largest chrome or ascending order. The position of the data points in the table after sorting is given as Sort Rank in the table above. If we take the data points from there and arrange them in a separate table in the same order, the following table will look like:
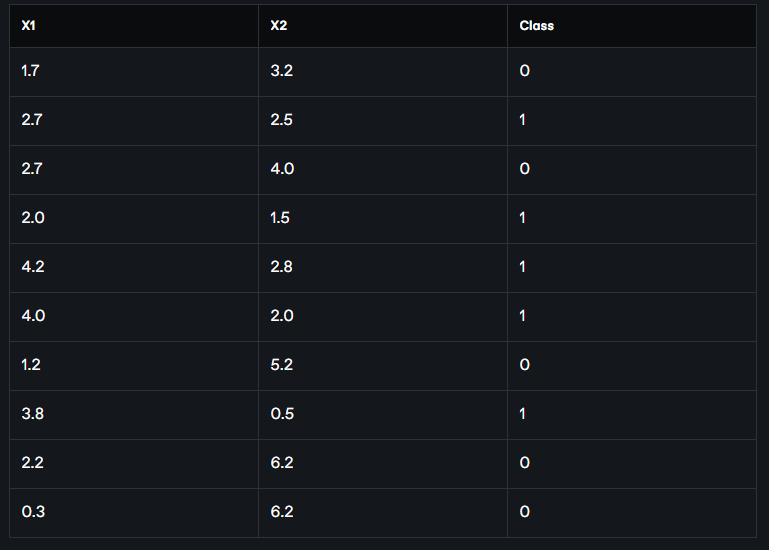
Now if we assume K = 3, we will work with the three closest points. Taking the first three rows of data points from the above table, we get the classes of the three closest points, which are 0, 1, 0 respectively, i.e. two cats and one dog (assuming 1 = dog, 0 = cat). Since there are more cats, we will denote the class of our point (2.2, 3) as 1 ie cats.
Again, if K = 5 does not hold, then we will work with the five closest points. If we take the first five rows of data points from the above table, we get the closest six point classes, which are 0, 1, 0, 1, 1 respectively, i.e. two cats and three dogs. So, in this case we will assign 1 ie dog as the class of our point (2.2, 3).
A value of K that is too small or too large can bias our conclusions. One way to find the optimal value of K is to take the square root of the total number of data (say n-number) as the optimal value of K. If, say, n = 150, then
K = sqrt(150) = 12.28 (approx) = 13 (approx)
Since the value of K will be odd, we will not take 12, we will take 13.
Python Implementation:
Step 1
We will use the scikit learn Python library to implement K-Nearest Neighbors.
Here we implement the K-nearest neighbors classification algorithm with the KNeighborsClassifier class. This is coming from our sklearn's neighbors module.
from sklearn.neighbors import KNeighborsClassifier
Step 2
We will use n_neighbors to set the value of K. Here n_neighbors=3, means three neighbors. As we have seen above, the most useful parameter of KNeighborsClassifier is the number of its neighbors.
knn = KNeighborsClassifier(n_neighbors=3)
Step 3
Sort the data.
# data

x1 = [4.2, 4.0, 3.8, 2.0, 2.7, 1.7, 2.7, 1.2, 2.2, 0.3]

x2 = [2.8, 2.0, 0.5, 1.5, 2.5, 3.2, 4.0, 5.2, 6.2,6.2]

classes = [5,6, 8,4, 2,1, 3, 7, 9, 10]

# turn the input features into a set of points

data = list(zip(x1, x2))
Step 4
"Fit" the data to our model.
knn.fit(data, classes)
We call the "fit" method from the knn object to build the model from the training set. When called, it takes two things as arguments. One, feature array and one target vector. Simply put, the ``fit'' command to the data and classes extracted in the previous step actually teaches the model the relationship between the feature metrics and the target vector. If you look at the output of the fit command, you will understand that this method is actually returning the knn object immediately. It also performs internal computations that are model dependent.
Step 5
Predicting labels for unknown, new data. The new data is called "out of sample" data. Since we have trained on the entire data, let's predict from a new data and see if it works? This model learns from training and predicts new data with a label. The output will be an array.
# predict the class of a new point

new_x1 = 2.2

new_x2 = 3

new_point = [(new_x1, new_x2)]

prediction = knn.predict(new_point)

print("Predicted result: ", prediction)
output
Predicted result: [1]
From the output we can see that the new data point is actually a dog (assuming 1 = dog, 0 = cat).
So far today.